With
our advanced tracking tools, you can already
view the opens of your email campaigns as they happen. But now
we've delivered something even better: maps of where your openers
are located.
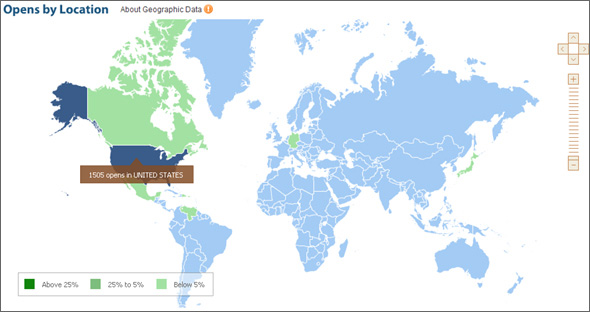
With Benchmark's new Open Maps feature, you can go
into your reports section and view a map
showing where your openers were when they opened your email or
newsletter. Here's what your map will look like:
We
think this feature is more than interesting,
but a great way to build better, more-targeted
campaigns. Think about it. With the Open Maps feature you can:
 |
Get
a solid, comprehensive idea of where
your openers are located |
|
Set
up campaigns based on pockets of different
subscribers |
|
Create
targeted emails and newsletters based
on geographic info such as weather, local
economic climate and more |
|
Segment
your lists based on where your openers
are located |
This free new
feature, available
for any campaign sent after April 25th, gives you a
colored map showing different countries and continents.
With this new data, you can create ultra-targeted,
personalized campaigns that show your recipients you
have a better understanding of where they live and
work. |